
Distinguishing EEG Signals from Other Frequencies
Our physical bodies are fascinating, functioning as sources of several different kinds of non-visible electromagnetic activities.
For instance, when you visit a doctor, and they check your heart using an ECG (electrocardiogram), they are measuring the electrical activity of your heart. Similarly, our brain’s activity can be captured through what’s known as EEG (electroencephalography) signals.
EEG signals are essentially the ‘brainwaves’ that are produced by the electrical activities occurring in our brain. These signals are crucial for understanding different cognitive states. For example, certain EEG patterns can indicate whether a person is awake, asleep, or even in deep meditation.
EEG vs. ECG
It’s interesting to note that while the heart’s ECG signals are stronger and have different patterns (like the familiar heartbeat pattern seen in medical dramas), EEG signals are unique to brain activity. They are more subtle and complex, reflecting the intricate workings of the brain.
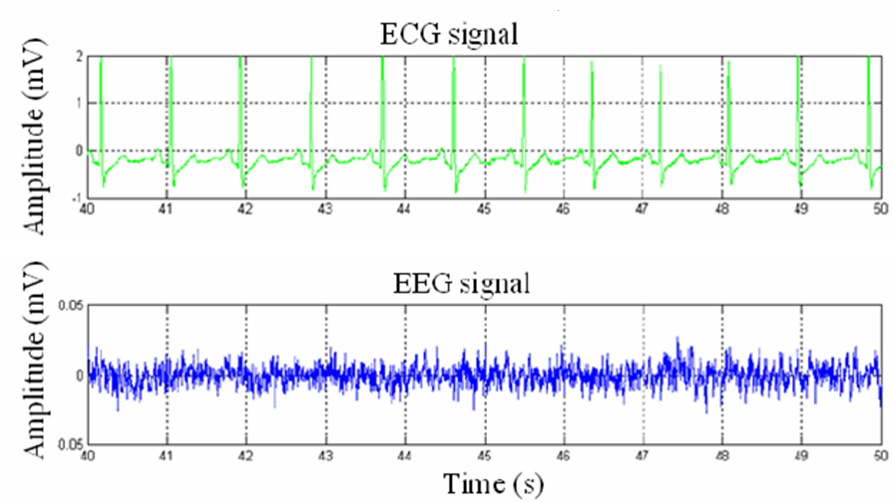
Figure 1- Comparative Amplitudes: This side-by-side illustration shows the difference in electrical signal strength between EEG and ECG recordings. The EEG (down) peaks at 0.02 mV, showcasing the subtle electrical activity of the brain, while the ECG (up) reaches up to 2 mV , reflecting the heart’s more robust electrical activity.
The Body’s Electrical and Chemical Signals
Our body operates through both electrical and chemical signals. For example, when you feel happy, chemicals like dopamine are released in your brain. This can change your EEG patterns, reflecting your altered mood. Similarly, if someone consumes alcohol, this chemical change in the brain can also be detected through changes in EEG patterns.
Another example: Imagine someone on a Netflix binge, deeply engrossed in a gripping series. As they experience various emotions – excitement, suspense, joy – their brain’s electrical activity changes. These changes in EEG patterns can be indicative of their engagement level and emotional responses, showcasing the dynamic nature of our brain’s electrical activity in response to external stimuli.
Mosh and I had an intriguing conversation last week in Toronto about the types of EEG data we can detect and the inferences that can be drawn from them. We discussed how EEG data, altered by factors like emotional responses to a movie or the effects of substances like alcohol, can provide insights into a person’s cognitive state. However, it’s crucial to note that while EEG can offer a window into brain activity, it still does not allow us to read specific thoughts.

Detecting EEG Signals
While EEG signals are primarily detected on the scalp skin or in ear, advanced techniques can sometimes detect these signals a very short distance away from the scalp. However, the idea of reading specific thoughts or psychic communication through EEG is currently not supported by scientific evidence. EEG provides a general picture of brain activity, not a detailed ‘read-out’ of thoughts.

Figure 2- Quantitative EEG Task Response: Slower and Weaker Brain Activity in Alcoholics Compared to Non-Alcoholics.
Individuality of EEG Signals
We received a question the other day about signals overlapping if there are several individuals together in a room and they all have their earbuds in – would that pose a problem.
In environments where multiple individuals are present, each person’s EEG signals remain unique to them and do not overlap. This is because EEG requires close proximity sensors (in-ear or over scalp), for accurate detection.
So, if a group of people in a room are all wearing EEG headsets or in-ear EEG earbuds, their brainwave data would remain distinct and separate.
We welcome questions about EEG and other types of bodily signals. Our goal is to help clarify these complex topics and make them understandable, even for those who are new to neuroscience.


